Weather briefings and COPs
Surface analyses, fronts, isobars and significant weather as live overlays on a common operational picture.
Zaes METOC Graphics draws every graphic in MIL-STD-2525E Change 1, Appendix M: fronts, pressure centers, isopleths, areas of weather, ice, depth, aids to navigation, hazards and mine warfare bottom descriptors, 354 in all. Each one is plain GeoJSON. The library and its editor are free under the MIT license and display on OpenLayers and MapLibre; commercial add-ons take the same graphics to Cesium, to TAK and from official feeds.
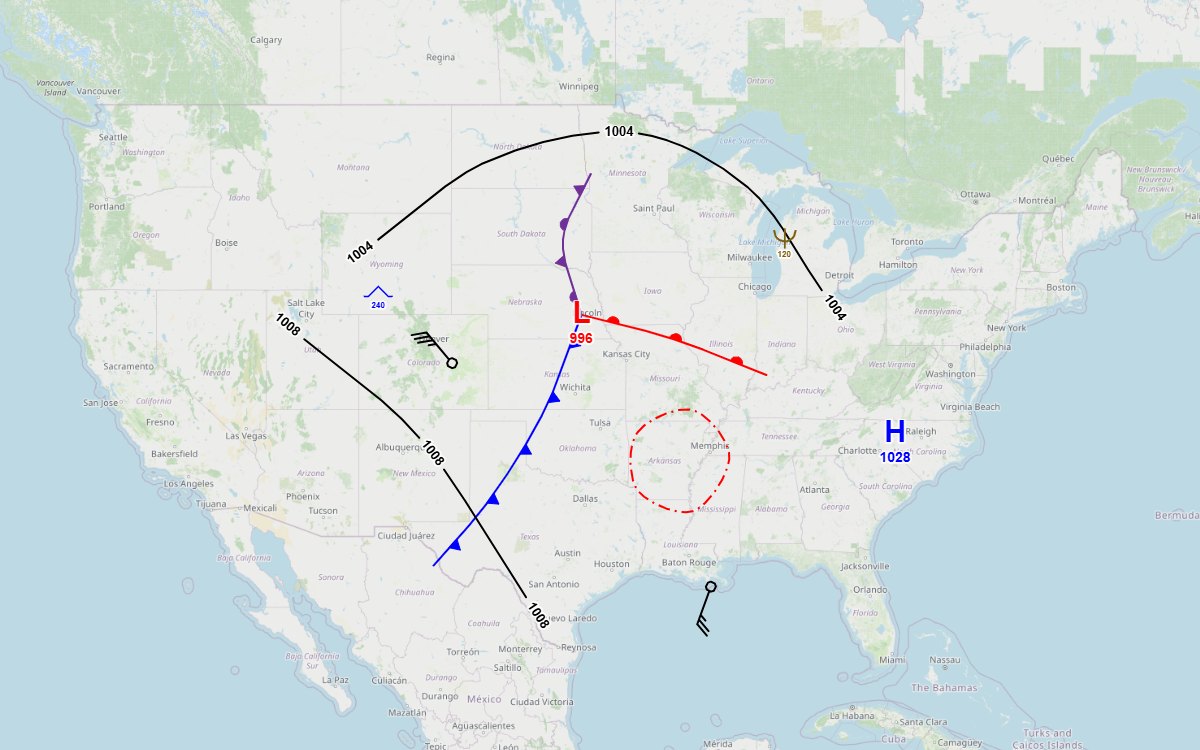
Weather and ocean conditions shape every plan, but they usually arrive as an image or a separate product. The library puts the standard's METOC graphics on the map the application already has, as data it can save, share and edit.
Surface analyses, fronts, isobars and significant weather as live overlays on a common operational picture.
IFR and MVFR areas, turbulence, icing, thunderstorms and the jet stream along the routes being planned.
Ice, depth curves, hazards, aids to navigation, currents and the mine warfare bottom descriptors in the standard's exact colors.
The same graphics in WinTAK and ATAK, exactly, and as plain shapes on any other TAK client.
These come from the sample application's Sample gallery, one group at a time. Pips, dots and other decoration keep their size on screen at every zoom, and fronts curve through the points the operator places. Click a picture to enlarge it, or open the live sample to draw and edit them on OpenLayers and MapLibre, in 2D and 3D.
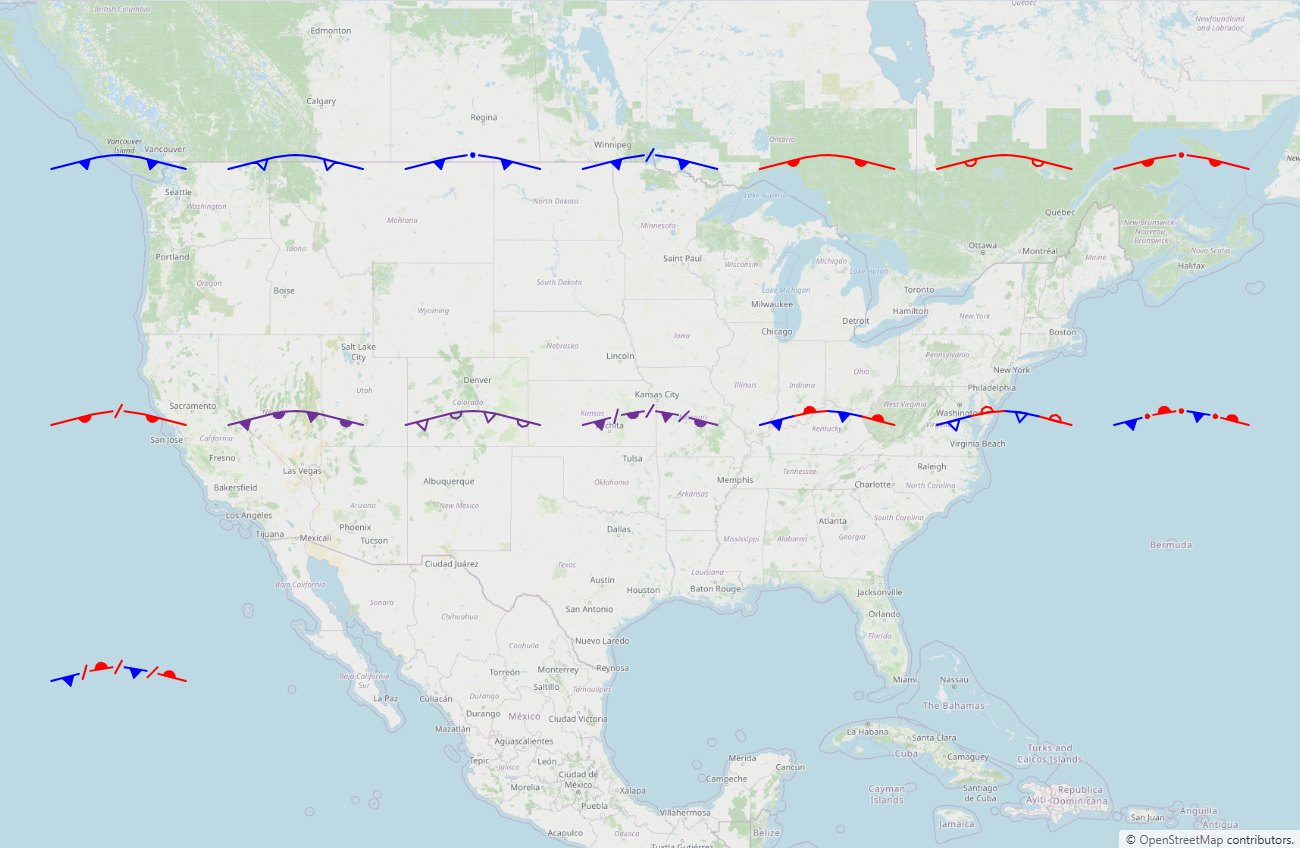
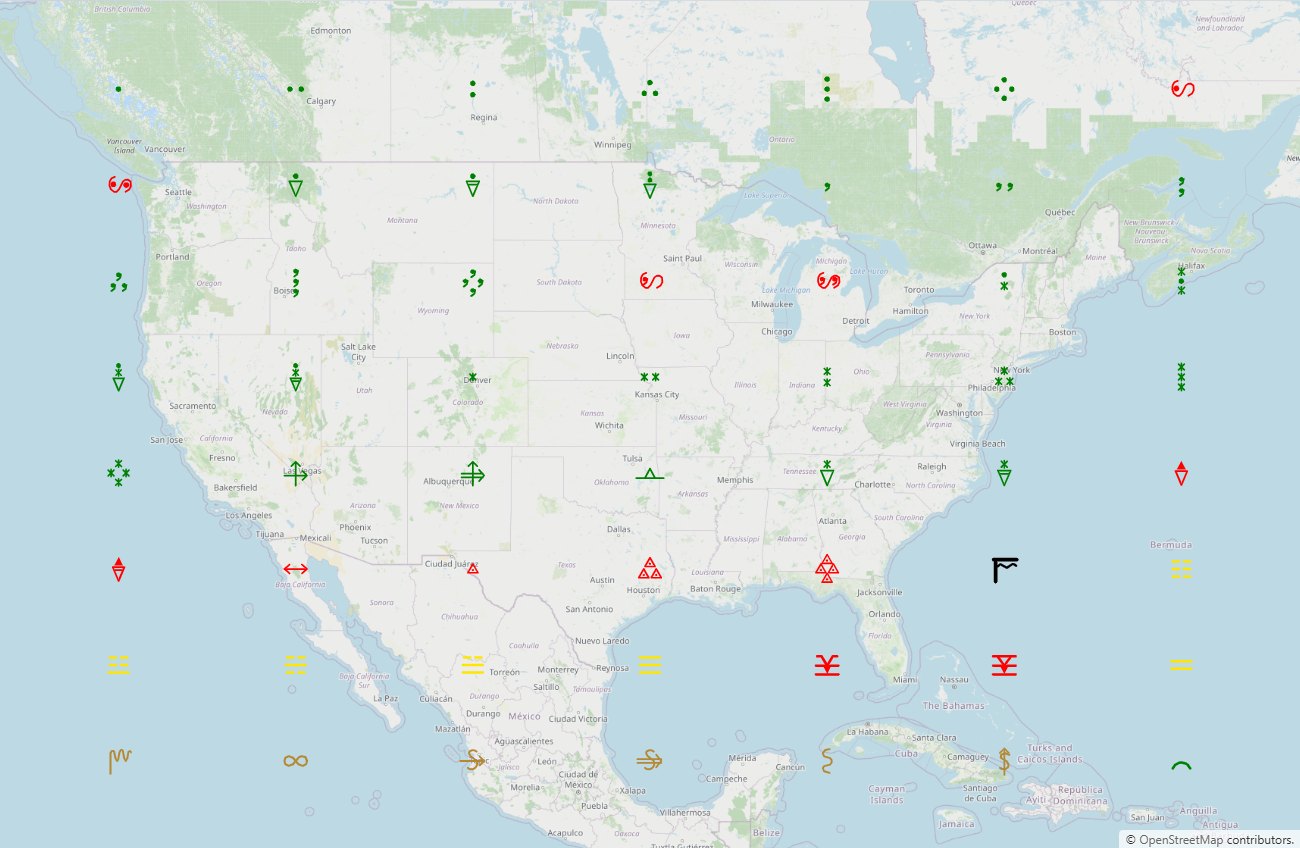
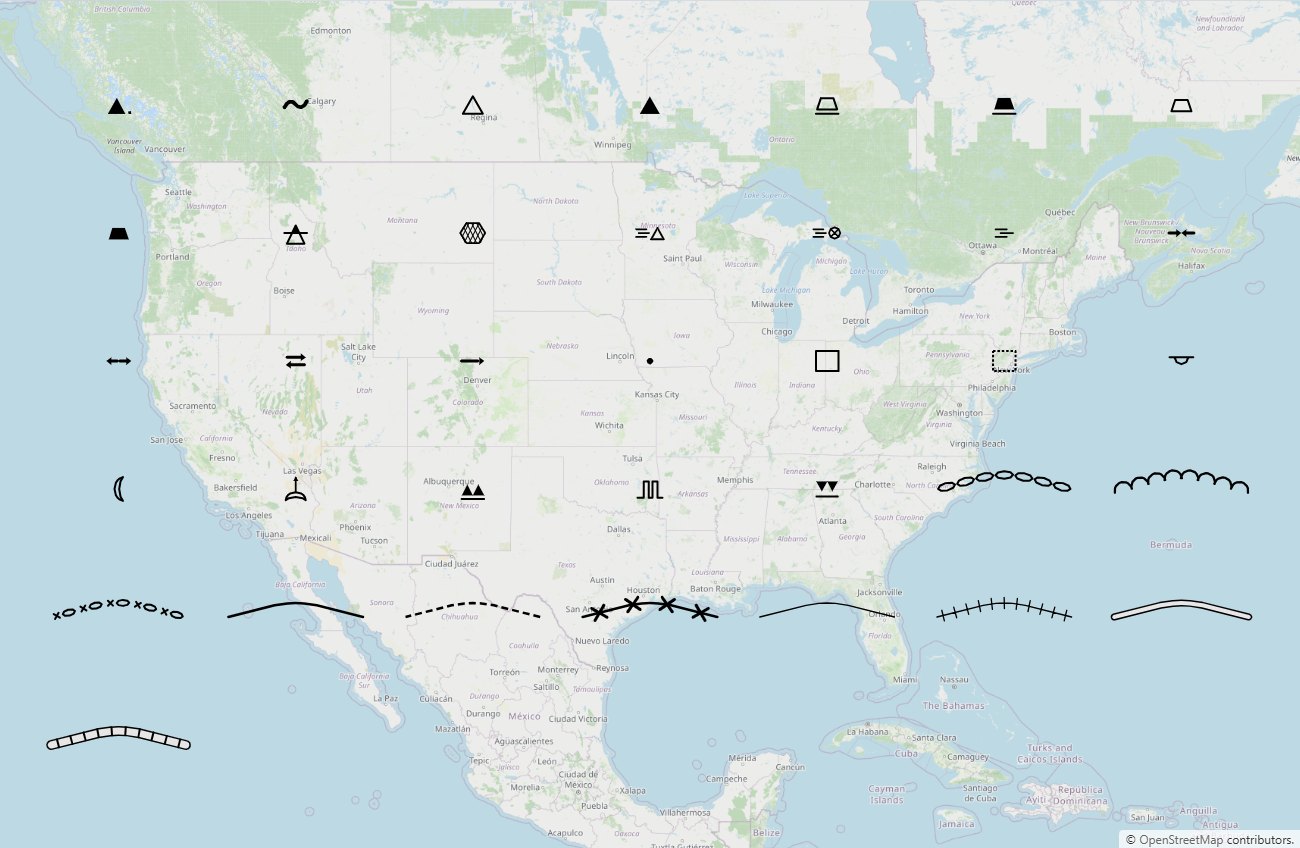
The open source package, @zaes/metoc, draws every graphic on a 2D map and lets operators draw and edit them, under the MIT license. Three commercial add-ons from Zaes take the same graphics and the same saved files further: onto Cesium terrain, into TAK with WinTAK and ATAK plugins, and in from official feeds. Each needs only the open source package, so a program takes the ones it uses. They are licensed by contract, separately from the MIT package.
The catalog and the paint layer, display renderers for OpenLayers and MapLibre, and drawing and editing on any of them in @zaes/metoc/editor. It needs no map library at its core, so it also runs in Node, a worker or a test runner.
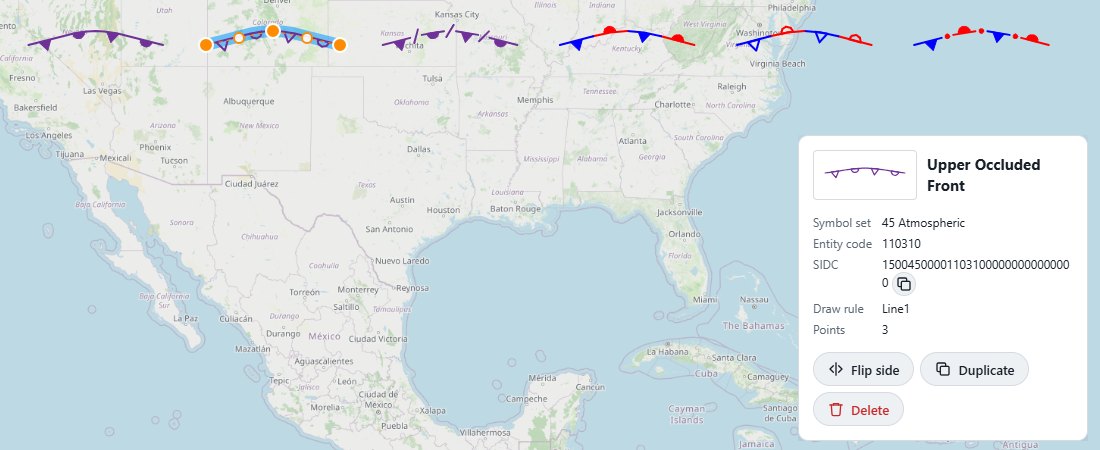 Click to enlarge
Every graphic on a Cesium globe, draped over terrain and 3D Tiles, and edited with the same editor as the 2D engines.
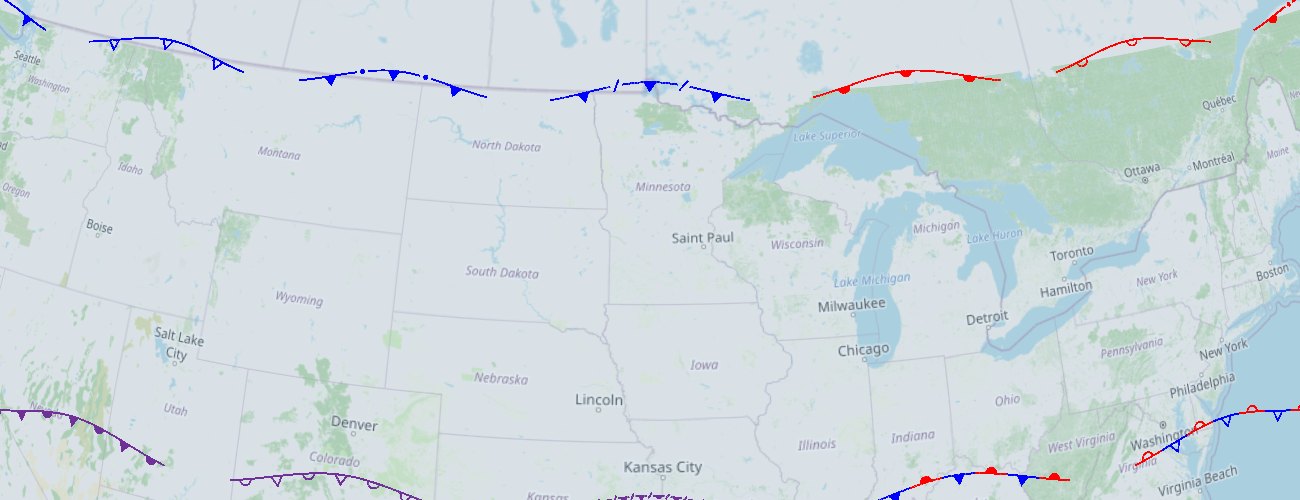 Click to enlarge
The graphics to TAK as Cursor on Target, so every client sees them, plus WinTAK and ATAK plugins that draw them exactly.
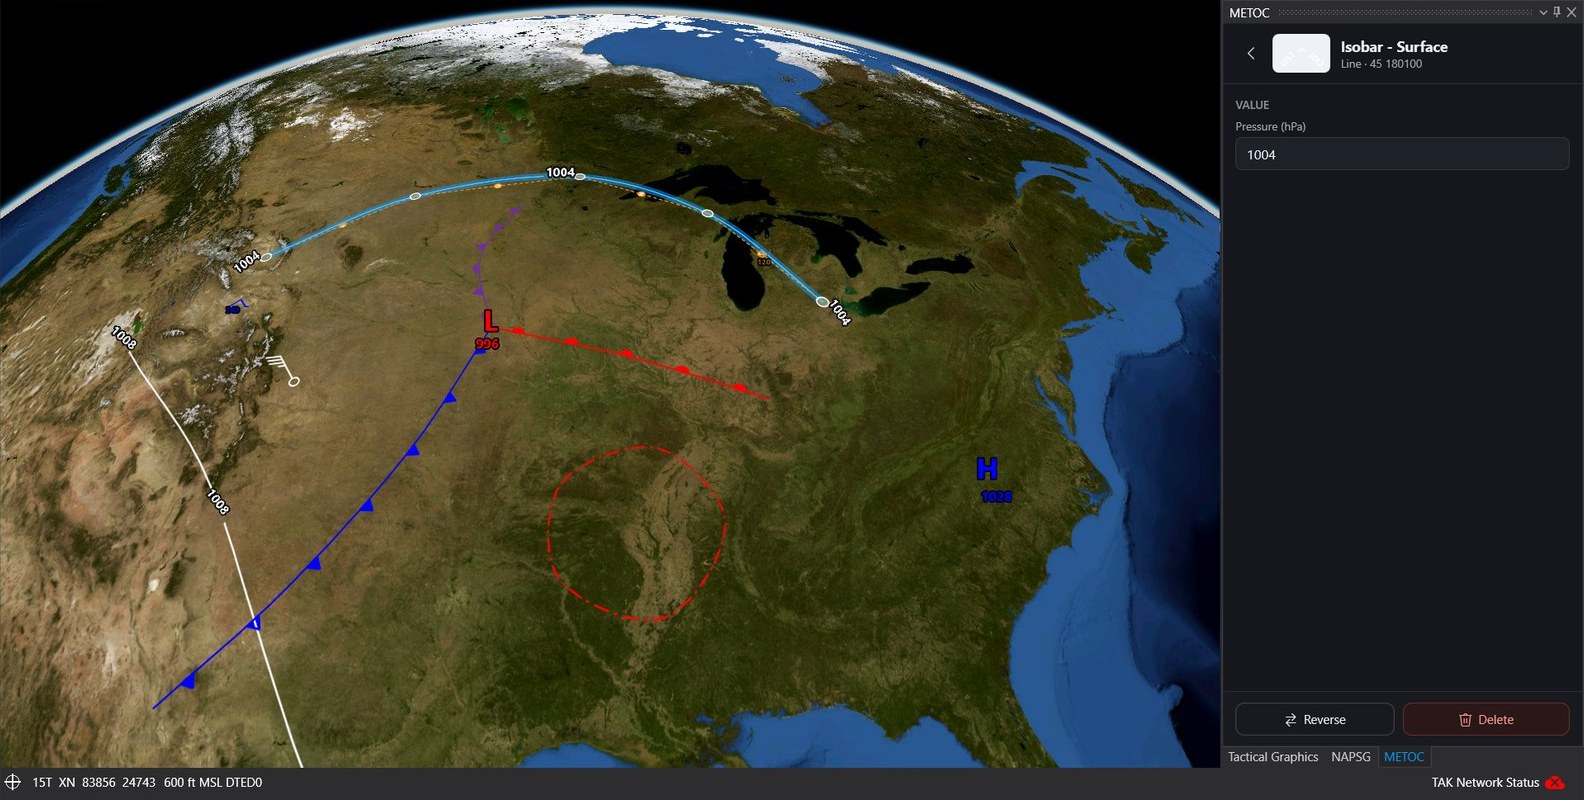 Click to enlarge
Official analyses and observations turned into METOC graphics, ready to display, edit or send to TAK. The converters need no network or browser, so they run on a server.
Each graphic saves as one GeoJSON feature: a Point, a LineString or a Polygon of the points the operator placed, with a metoc property for its name and value. Nothing about the view is stored. The renderers paint it fresh at every zoom.
import { MetocGraphicName, MetocCollection, metocFeature }
  from '@zaes/metoc';
import { MetocOpenLayers }
  from '@zaes/metoc/openlayers';

// Points in drawing order: it sets a front's pip side.
const front = metocFeature(
  MetocGraphicName.ColdFront,
  [[-80, 40], [-90, 42], [-100, 41]]
);

// Wind is data: degrees true and knots.
const barb = metocFeature(
  MetocGraphicName.WindBarb, [[-97.5, 35.4]],
  { windDirection: 270, windSpeed: 65 }
);

const collection = new MetocCollection();
collection.load({ type: 'FeatureCollection',
                  features: [front, barb] });
new MetocOpenLayers(map, collection);The package's root runs in a browser, a worker or Node. OpenLayers and MapLibre are optional peers, and Cesium is handed in by the application.
Each renderer is a map host: where things are on screen, pointer and key events, and an overlay. The editor attaches to a host, which is how Cesium got editing.
A wind barb is a Point with a direction and a speed, and a station plot adds sky cover, temperature, dew point, pressure and weather, drawn as the WMO station model around Appendix M's own symbols. Isopleths carry their value; the barb rounds to the nearest five knots.
A graphic drawn across 180° is saved continuous and painted the short way on every engine, and folded back into ±180° for KML, CoT and TAK.
| Package | What it provides |
|---|---|
@zaes/metoc (MIT, npm) | The catalog, the paint layer, GeoJSON save and load, validation, SIDCs, thumbnails; display renderers …/openlayers and …/maplibre; drawing and editing on any engine, undo and redo, and the properties-field registry in …/editor |
@zaes/metoc-cesium (commercial) | The Cesium renderer, draped on terrain and 3D Tiles; Terrarium terrain with no ion |
@zaes/metoc-tak (commercial) | CoT for every TAK client, the TAK icon set, live sync with TAK Server, the WinTAK and ATAK plugins, data packages, KML and KMZ |
@zaes/metoc-feeds (commercial) | WPC surface bulletins, AWC G-AIRMETs and SIGMETs, and METARs as METOC graphics |
The library follows MIL-STD-2525E Change 1 (March 2025), Appendix M: Table A-LI and A-LII for names and entity codes, Table M-II and M-III for each graphic's color and drawing, and Table M-I for the draw rules. Automated tests pin every drawable code of both symbol sets to the standard, and every label its notes document.
Zaes does not claim government certification or independent conformance validation. Programs should perform the review appropriate to their mission and configuration.
Atmospheric: pressure centers, fronts, pressure lines, winds, isopleths, areas of weather, cloud cover, weather, storms, turbulence, icing and the state of the ground.
Oceanographic: ice, depth and coast, ports and harbors, aids to navigation, hazards, bottom features, tide and current, bioluminescence, beach slope, mine warfare and maritime limits.
Every graphic with an entity code has a 2525E SIDC, and a SIDC reads back to its graphic. The wind barb has a draw rule but no entity code in the standard, so none is invented.
Where a color is the information, such as a bioluminescence level or a bottom category, it is the exact RGB the standard prints, and no palette moves it.
Where a table contradicts itself, the library follows the name and the drawing and records the discrepancy with the graphic.
On ATAK, sending into a Data Sync mission: its edits go to the TAK servers ATAK is connected to, and a mission's graphic is revised in place. iTAK and WebTAK show the plain CoT shapes.
The catalog lists every graphic by symbol set and category, with its entity code, each drawn by the library itself. Search by name or code.
Send us the mapping environment, the weather and ocean data you have, and where the graphics have to go. We can tell you whether the open source package covers it, set up an add-on evaluation, and help with the integration.